
© Lukas Klose / Universität Bremen
Tram Measures Bremen’s Air Pollution
Where exactly in Bremen is the level of harmful nitrogen dioxide (NO2) in the air too high? A measuring device from the University of Bremen is riding along on top of a local streetcar to find out.
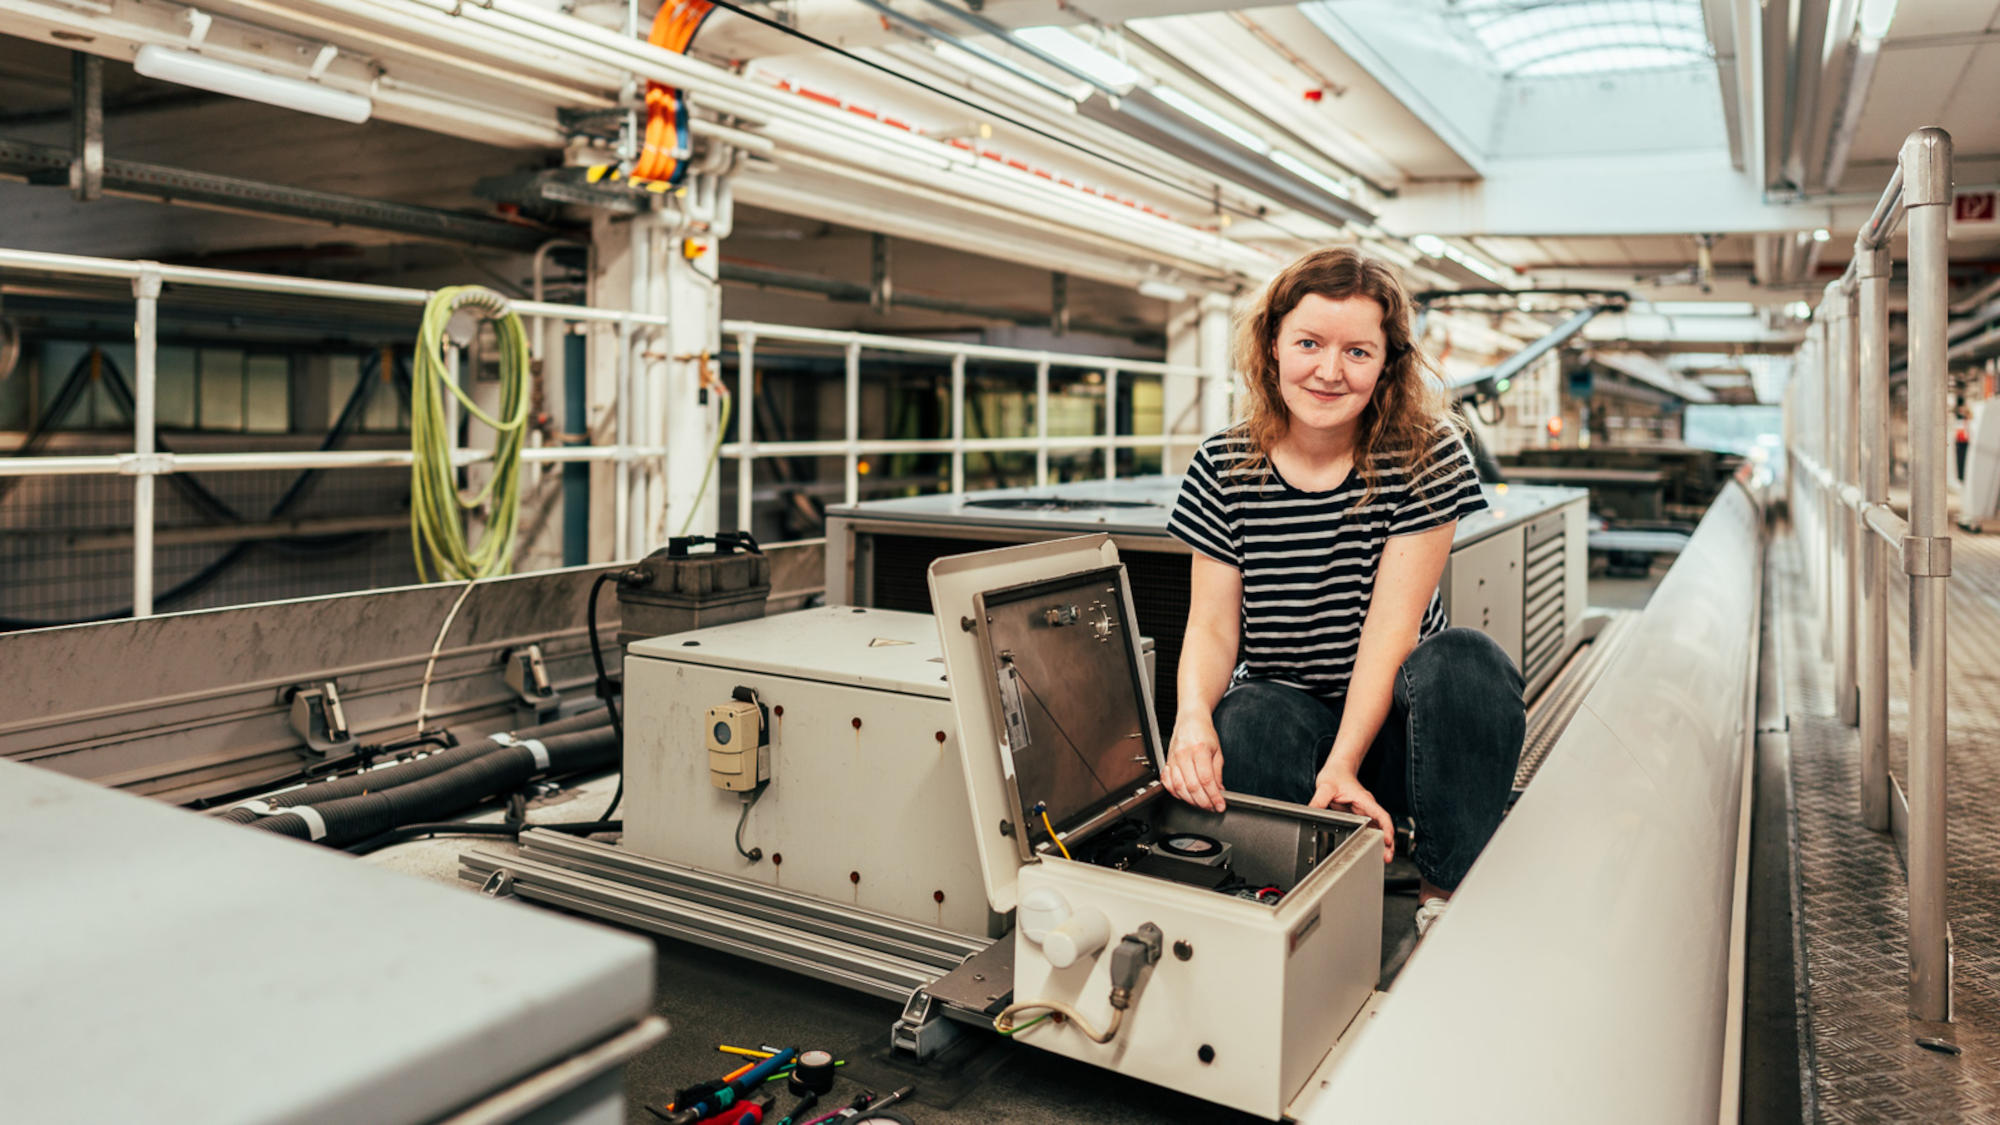
PhD student Kezia Lange from the Institute of Environmental Physics at the University of Bremen is convinced: She is the only researcher in Germany to use a tram in the field of atmospheric remote sensing to collect data on the air quality of a major city. After all, Bremen has one great advantage over most other metropolitan areas: The streetcar travels all over the city – and completely above ground. This makes it ideal for mounting a self-constructed measuring device with integrated spectrometer on its roof.
Even non-experts can easily imagine a measuring device traveling on top of a tram recording air quality in different parts of the city. This kind of research is easy to understand and makes for a good party conversation starter. Interested people frequently want to know more details about the work of the 31-year-old physicist. Of course, on closer inspection, her project is not quite as trivial. After all, it is related to one of the United Nations’ 17 Sustainable Development Goals. But let’s look at it one step at a time.
In the beginning, there was a flash of inspiration. It came to the mind of Dr. Andreas Richter, head of the Differential Optical Absorption Spectroscopy working group, DOAS for short, at the Institute of Environmental Physics at the University of Bremen. Richter is Kezia Lange’s PhD supervisor. He discussed her thesis topic with her and helped to figure out how she could put it into practice. His idea for collecting data: Why not use a public transportation system that travels around Bremen every day anyway? “Until then, we had been driving around by car or bicycle,” Lange recalls. But that was comparatively time-consuming and therefore the researchers could only do it sporadically. To get a more comprehensive picture, the idea of using the streetcar came just at the right time.
© Lukas Klose / Universität Bremen
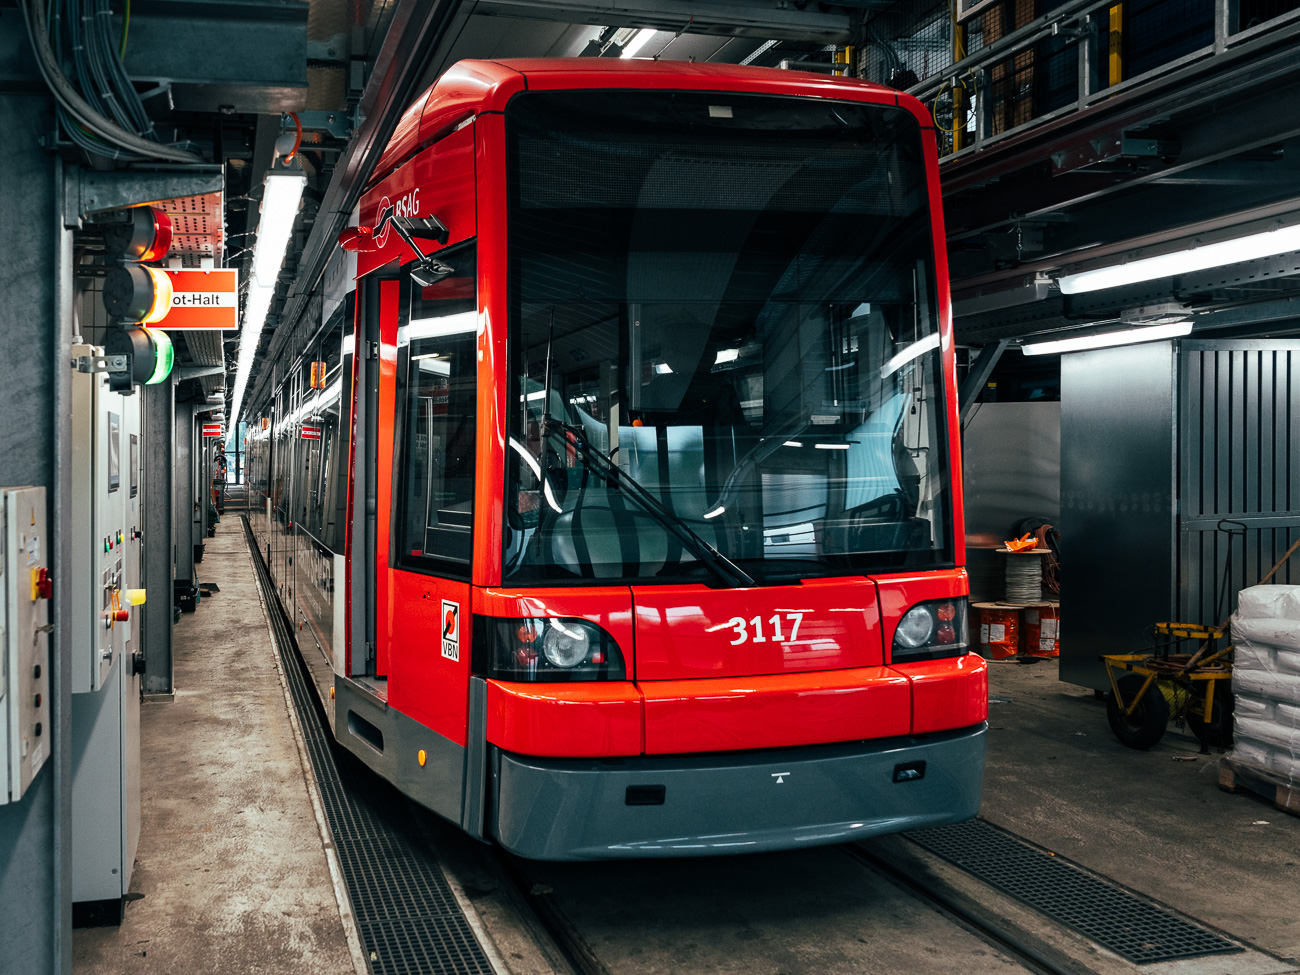
Bremer Straßenbahn AG (BSAG) was open to the idea and provided tram number 3117. In November 2021, Kezia Lange drove to the BSAG maintenance depot in the Neustadt district and mounted the measuring device on the tram roof. She placed it well protected in a waterproof metal box and not too close to the pantograph, which produces a fair amount of dirt. The windows of the box have to remain clear for the measurements to work.
One Measurement Every Ten Seconds
How does this type of measurement work? The tram travels through the city on a normal scheduled service. However, its route changes randomly, because the streetcar is deployed on different lines. This is entirely consistent with Lange’s intentions. After all, she wants data from the entire city. Every ten seconds, the device measures the sunlight shining in through the windows.
“A rotating mirror is used to access these measurements with an integrated measuring computer. Through a converging lens, the sunlight is coupled into a fiber-optic bundle and finally fed into a spectrometer,” Lange explains. You might remember a spectrometer from physics class in high school: It is a device that separates light into its spectral components, i.e. separates the individual color components from one another. The device automatically transmits the recorded spectra to the university computer at night via a mobile phone network.
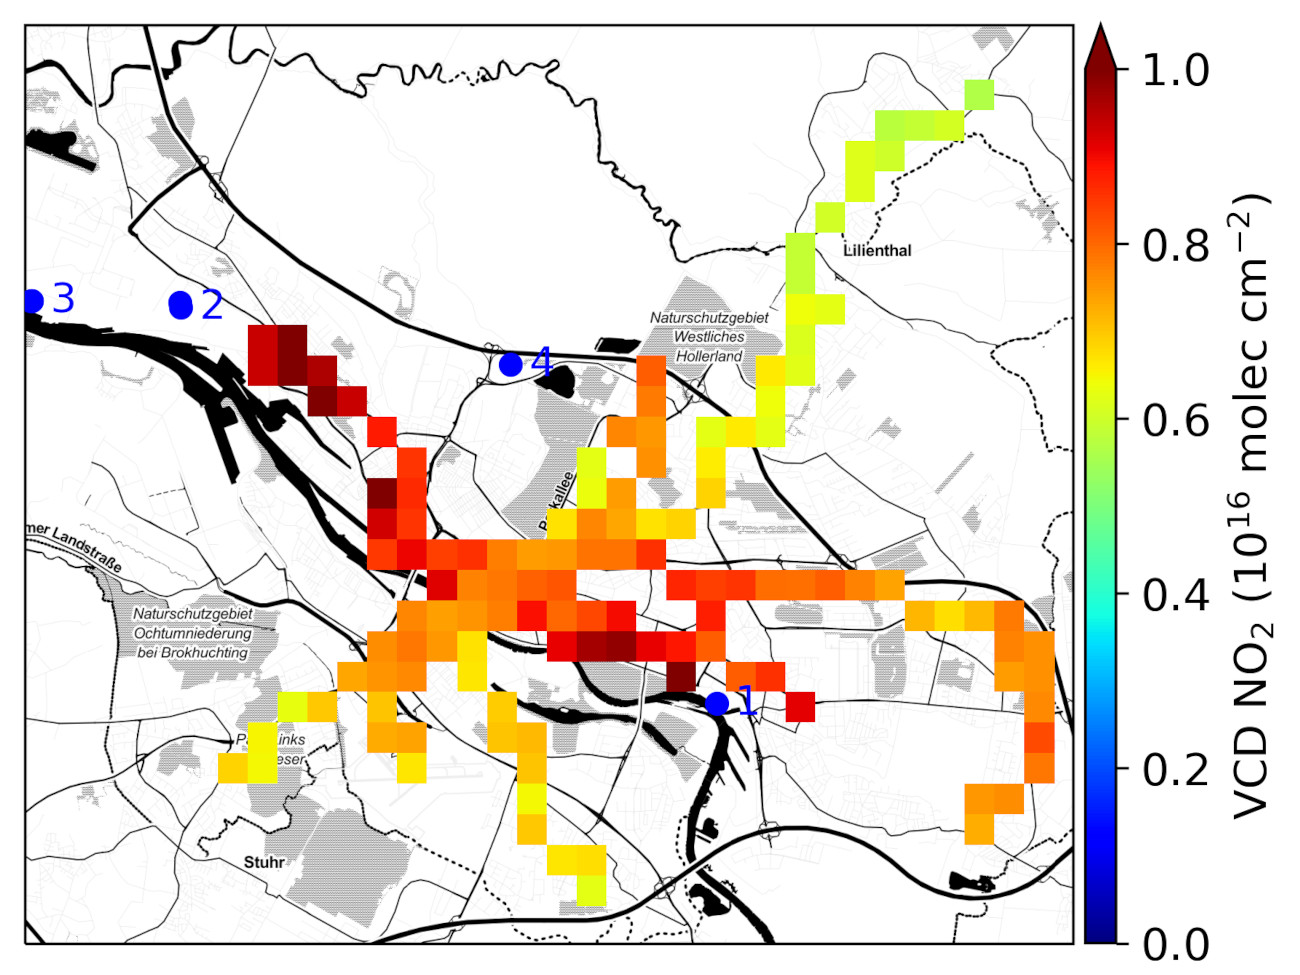
Since the NO2 in the atmosphere absorbs a certain portion of the sunlight, it leaves a kind of fingerprint in the spectrum. “We then analyze this data on the computer to determine how much NO2 is present in a particular measurement,” the physicist explains. We then correlate the result to the recorded GPS data so that we can assign the recording to a specific location in Bremen. “This gives us a very dense picture of the urban area.”
© Universität Bremen
West Bremen and Area around Hastedt Power Plant Particularly Polluted
But where in Bremen is the level of NO2 in the air particularly high? “In West Bremen, as there are many large emitters such as the steel mill, several power plants, and a waste incineration plant, but also around the Hastedt power plant,” Lange reports. She was not surprised that these industrial sites emit harmful gases into the atmosphere. However, she did not expect the power plant in Hastedt to be prominently featured as a single polluter in the urban landscape. Additional findings: NO2 pollution is higher in winter than in summer – especially when there is little or no wind. And days with plenty of rain remain a mystery. “During heavy rainfall, the readings from the device are virtually useless and unfortunately I have to throw the data away,” the physicist states.
Measurements have been taken again since mid-July. Previously, there was a forced break of several months due to a technical defect. Lange hopes that she and her colleagues will be able to go into even more detail in the future. Although her research is far from over, her interim assessment of Bremen’s air quality is not bad at all: “Compared to other regions, Bremen is a pretty clean city.” In the Ruhr region, for example, pollution is much higher. Globally, the situation is especially bad in China.
© Lukas Klose / Universität Bremen
Kezia Lange knows that her research makes an important contribution to healthier and more sustainable urban living. High levels of NO2 pollution ultimately lead to health-threatening ozone and smog. “That is why it’s so important to know exactly where pollution is distributed locally,” Lange states. She believes that one day her data will be compared with the power plant and steel mill operators’ own data, thus providing an instrument of control. The data is also used to validate satellite measurements of nitrogen dioxide levels.
Even though she recently completed her PhD, Kezia Lange will continue to supervise the project. In the future, her research focus will also be on Southeast Asia. “I will be analyzing one of the most polluted corners of the world here from the institute: the South Korean metropolis of Seoul,” she states. She was surprised when she entered into the new research field: Supposedly, pollution levels in Seoul are at their peak at 11 a.m. “I find that hard to believe. Are there still so many people driving their cars at that time, or is it a time when people heat their homes in particular?”