
© Pia Goetz
Micro-CT Measurements: the Inner Composition of a 16th-Century Shard
How Computed Tomography Supports Materials Scientists in Their Research
What do a torn ligament in the ankle and an air bubble in a 16th century shard have in common? Both can be determined and measured non-destructively. With a computer tomography scanner – such as the one in use at the MAPEX Center for Materials and Processes at the University of Bremen.
We’ve all heard the term computer tomography before. Some may have even gotten to know one firsthand. The use of computed tomography (abbreviated to CT) in medicine means that detailed images can be taken and even the smallest changes in human tissue can be made visible. It is mainly used in diagnostics of the skeletal system, the brain and internal organs and blood vessels. This way, doctors gain an insight into the interior of the body without having to open it. It’s a clear advantage over old methods, and the ones from the early 16th century we would rather not look relive. Leonardo da Vinci’s detailed anatomical drawings, for example, are apparently based in part on self-conducted dissections. If only there had been computed tomography at that time.
What Exactly Does All This Have to Do with a Shard?
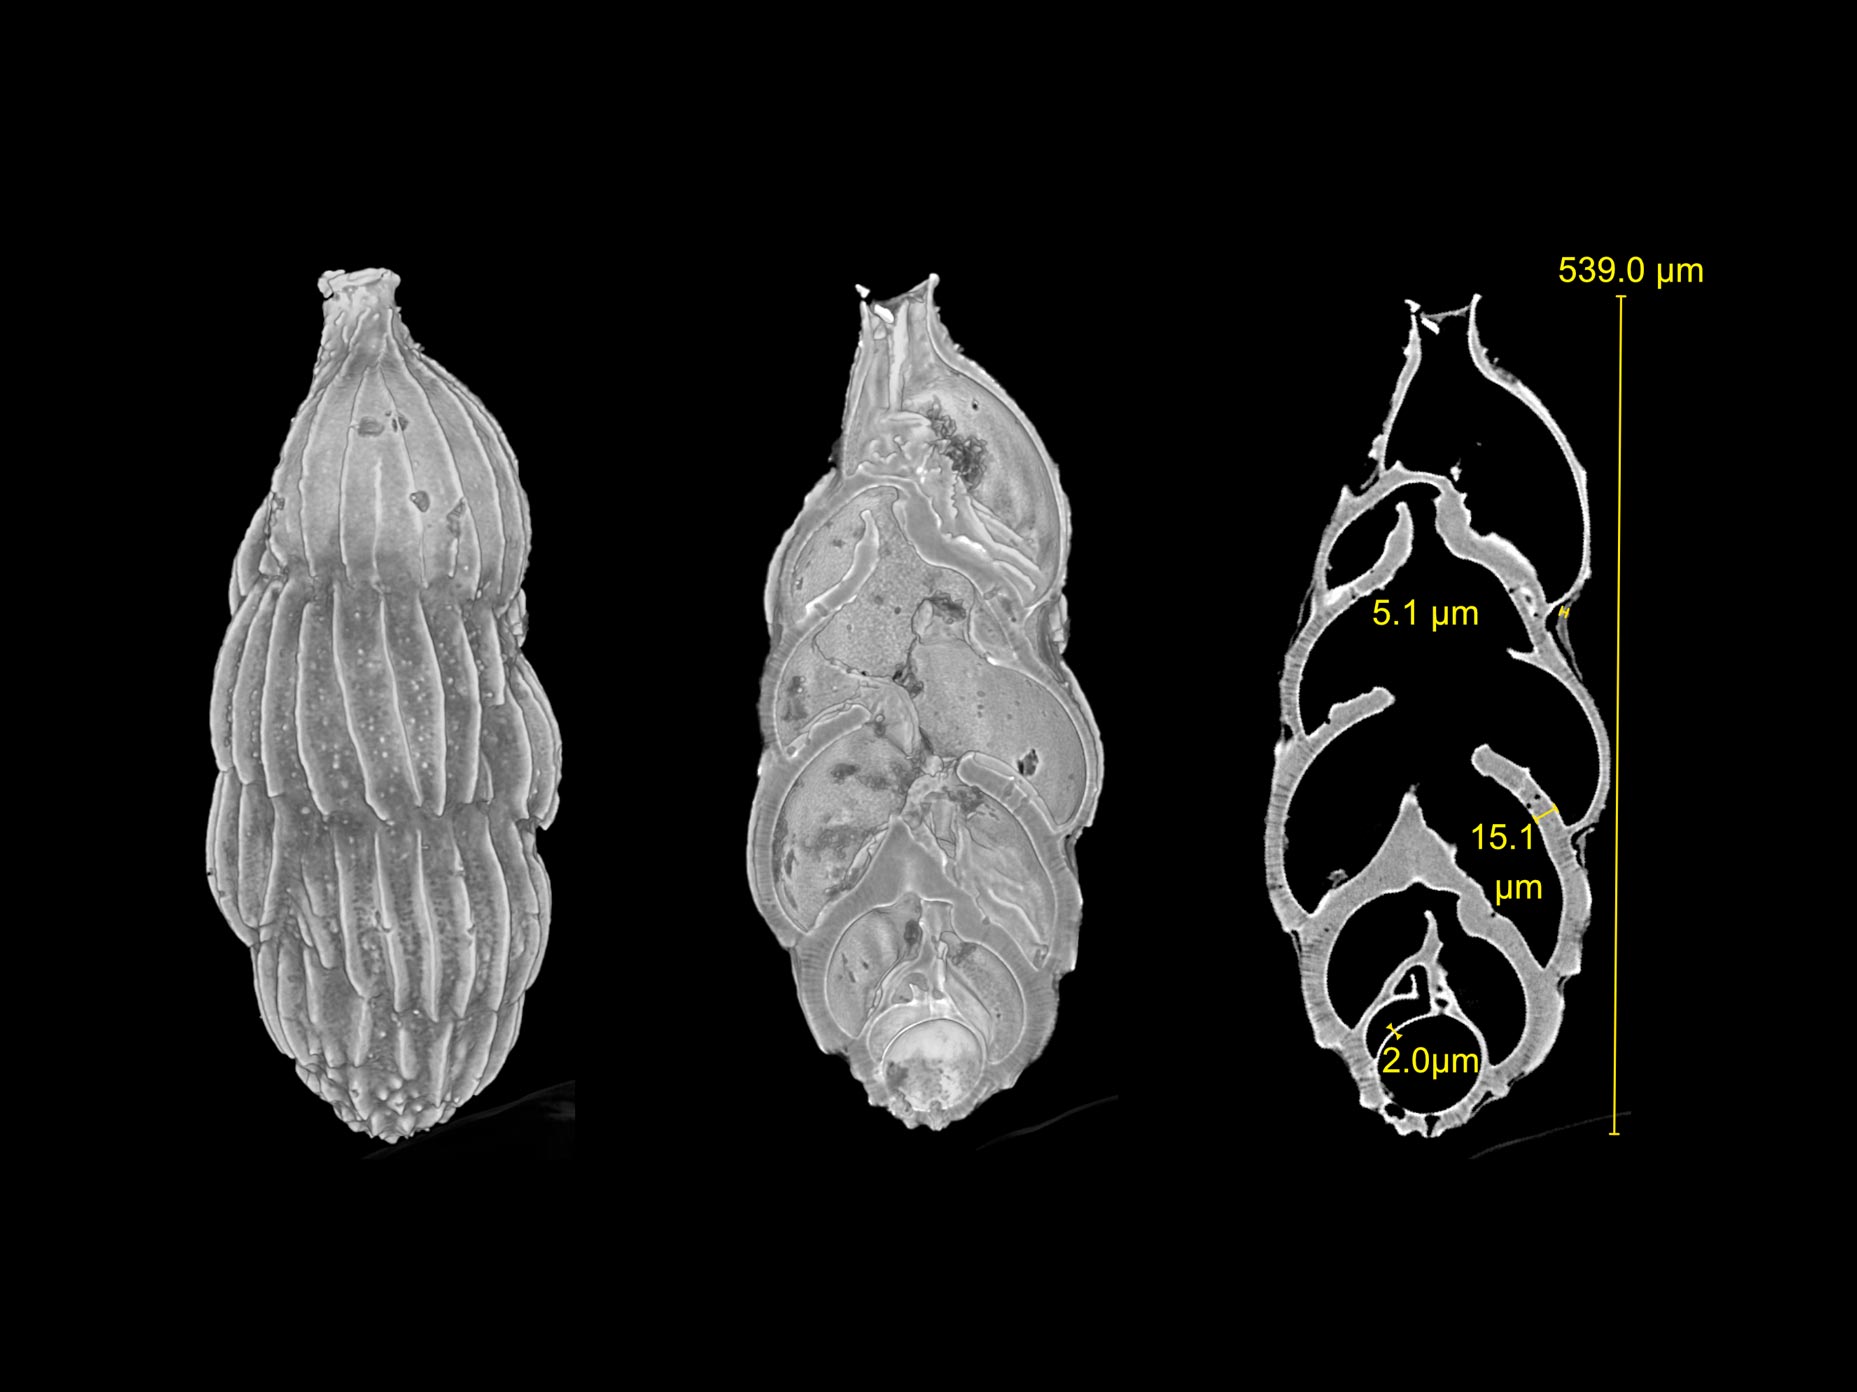
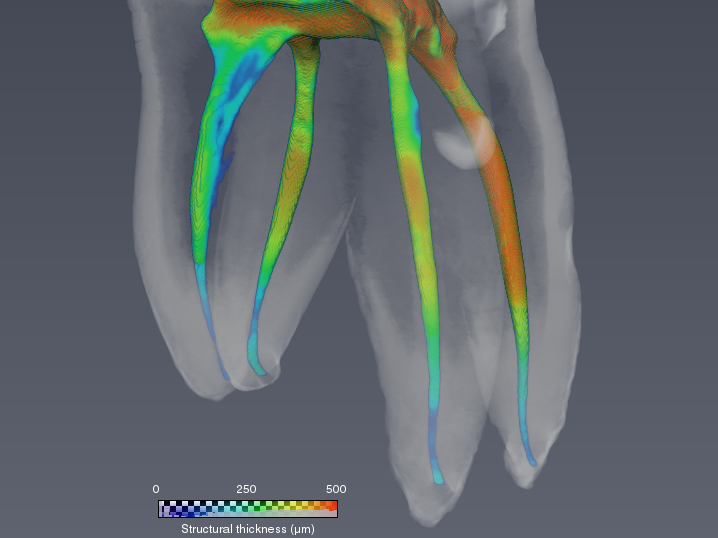
Originally developed for medical use, the technology is now also used in nonmedical sciences, such as the MAPEX Center for Materials and Processes at the University of Bremen. Objects made of different materials are examined with an X-ray microscope. From tiny foraminifera (see Figure 1), to fiber and rock samples, to teeth (see Figure 2). And also a shard from the 16th century. This article uses this shard to explain computed tomography in materials science.
© MAPEX Wolf-Achim Kahl
© MAPEX Wolf-Achim Kahl
The Emergence of a Digital Shard in the 21st Century
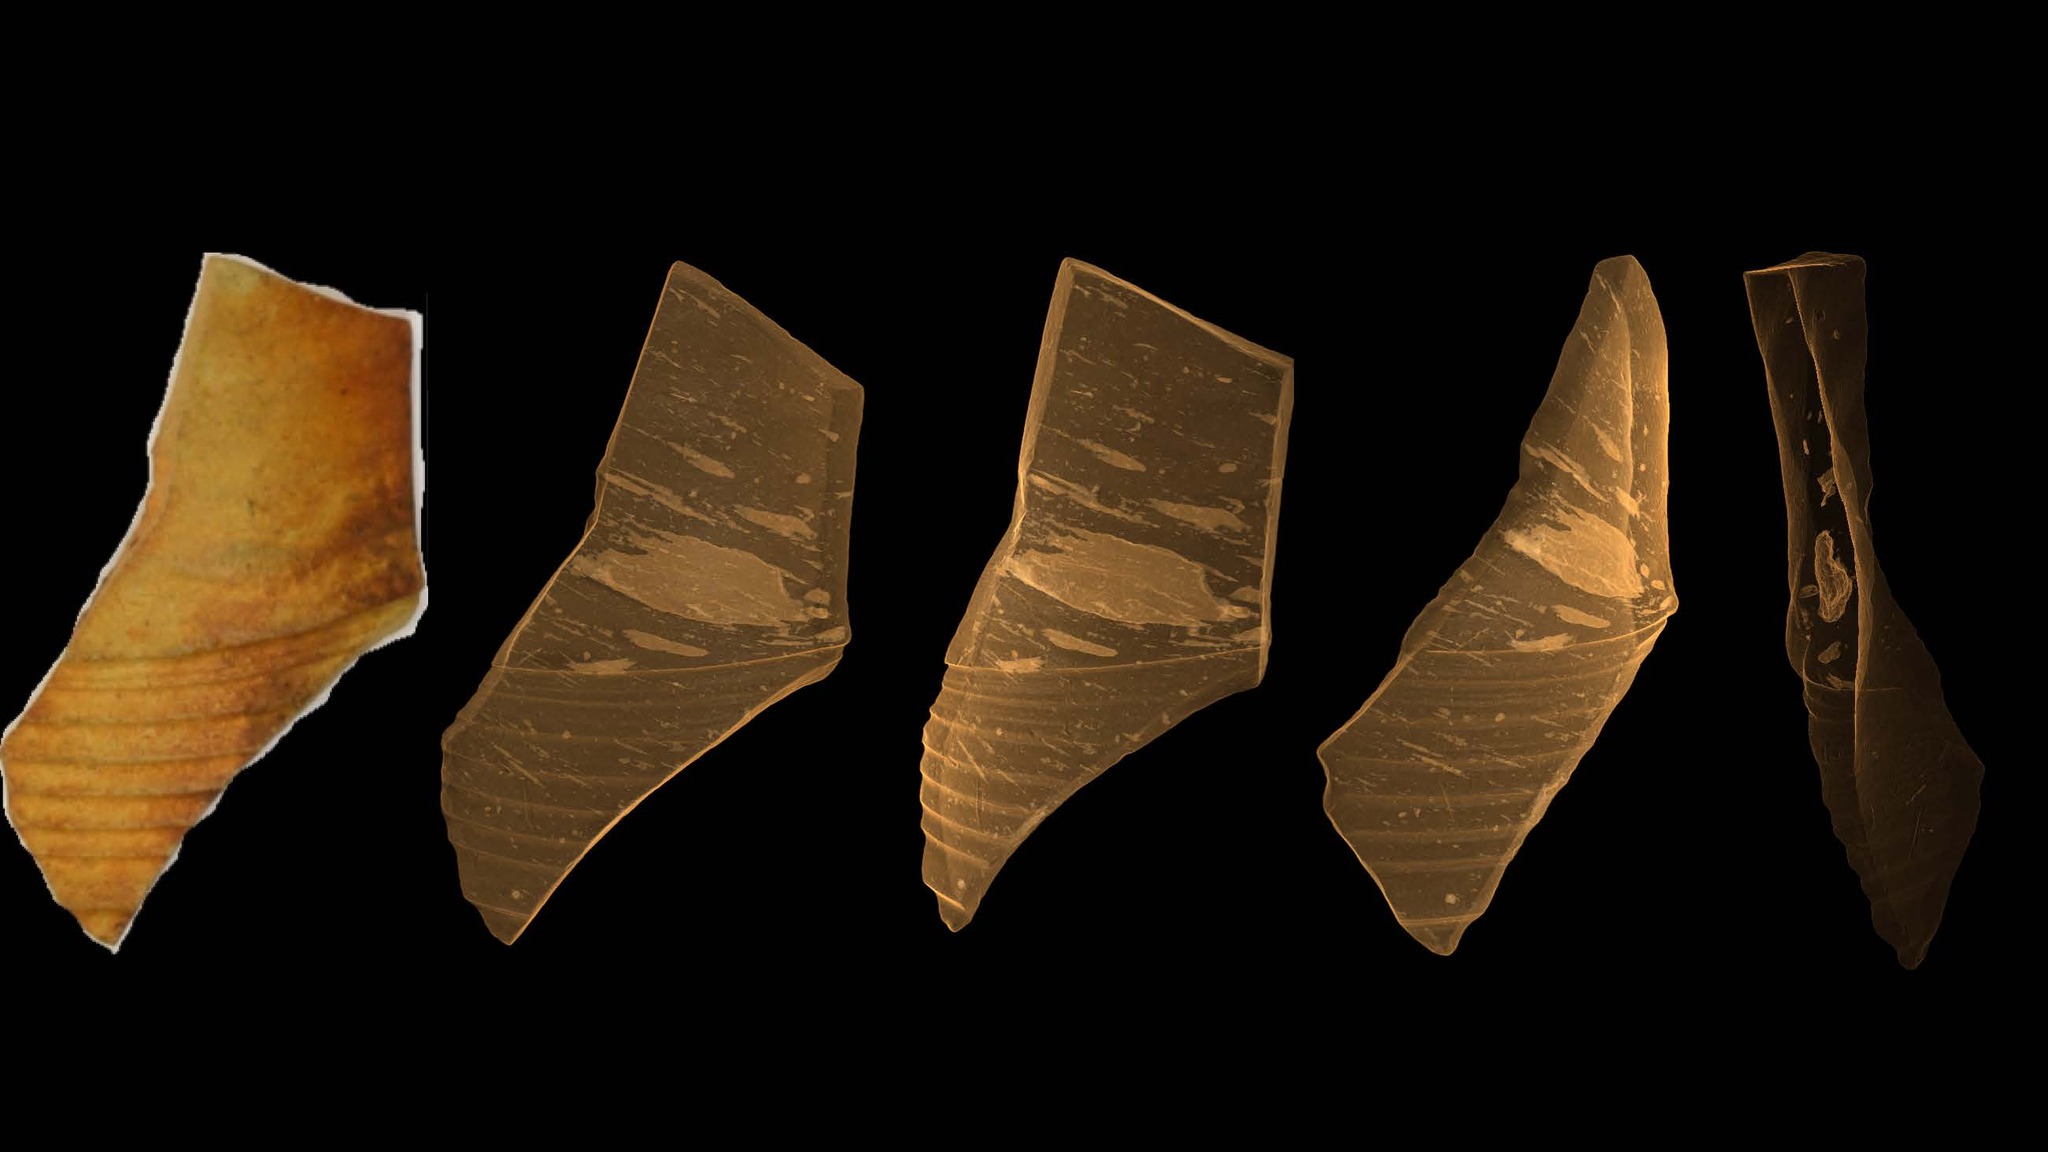
The shard from the early 16th century, when da Vinci was still dissecting for his records, is placed on a rotating plate, as shown in the schematic diagram in Figure 3. Unlike what we know from hospitals, the X-ray source and detector do not rotate around the body part to be examined, but rather the shard rotates around its own axis, while the X-ray source and detector remain firmly in their positions.
The X-ray source, to the left of the shard, generates X-ray radiation. The detector, to the right of the shard, measures the intensity of the radiation after it has passed through the object and converts it first into visible light and then into electrons with a photodiode. The distances between the individual measuring points on the detector determine the pixel size and spatial resolution. All pixels of an image are combined to form a 2D overall image, also called a projection. The intensities for each pixel are displayed as gray-scale values, resulting in a black-and-white image. The more opaque a point in the object, the greater the attenuation of the output radiation, and the lower the radiation perceived by the detector at that point.

© Pia Götz
After each individual measurement, the plate with the shard continues to rotate by a tenth of a degree until the object has been completely measured. This results in around 2,000 x-rays from different angles. In general, 180° is sufficient as a rotation, as everything above 180° has already been measured, only from the other side.

© Pia Götz
The Reconstruction – Projections Become Sections
The projections under the different viewing angles are then calculated back to a 3D object using an algorithm. The result is referred to as a reconstruction. In addition to the measured intensities, the geometry of the measurement setup is also required, i.e., how far apart were the X-ray source, object, and detector in each case. After the so-called retrojection, our sample shard from the 16th century is now available as a gray-scale-value image stack of individual sections. In other words, virtual sections of the object. This also explains the term tomography. Thus τομή, tome in ancient Greek means “cut” and γράφειν, graphein means “write.”
© Pia Götz
A Large Shard of Clay
Measuring a shard may take several hours, depending on the size and desired resolution. Reconstruction also takes a lot of time and, on top of that, enormous computing power. This means that the individual projections of a small shard to take up to 20 gigabytes of space. For comparison, the movie Matrix takes up less space on the hard drive with its 2 hours 16 minutes in the 4K Ultra HD version.
© Pia Götz
65,536 Shades of Gray
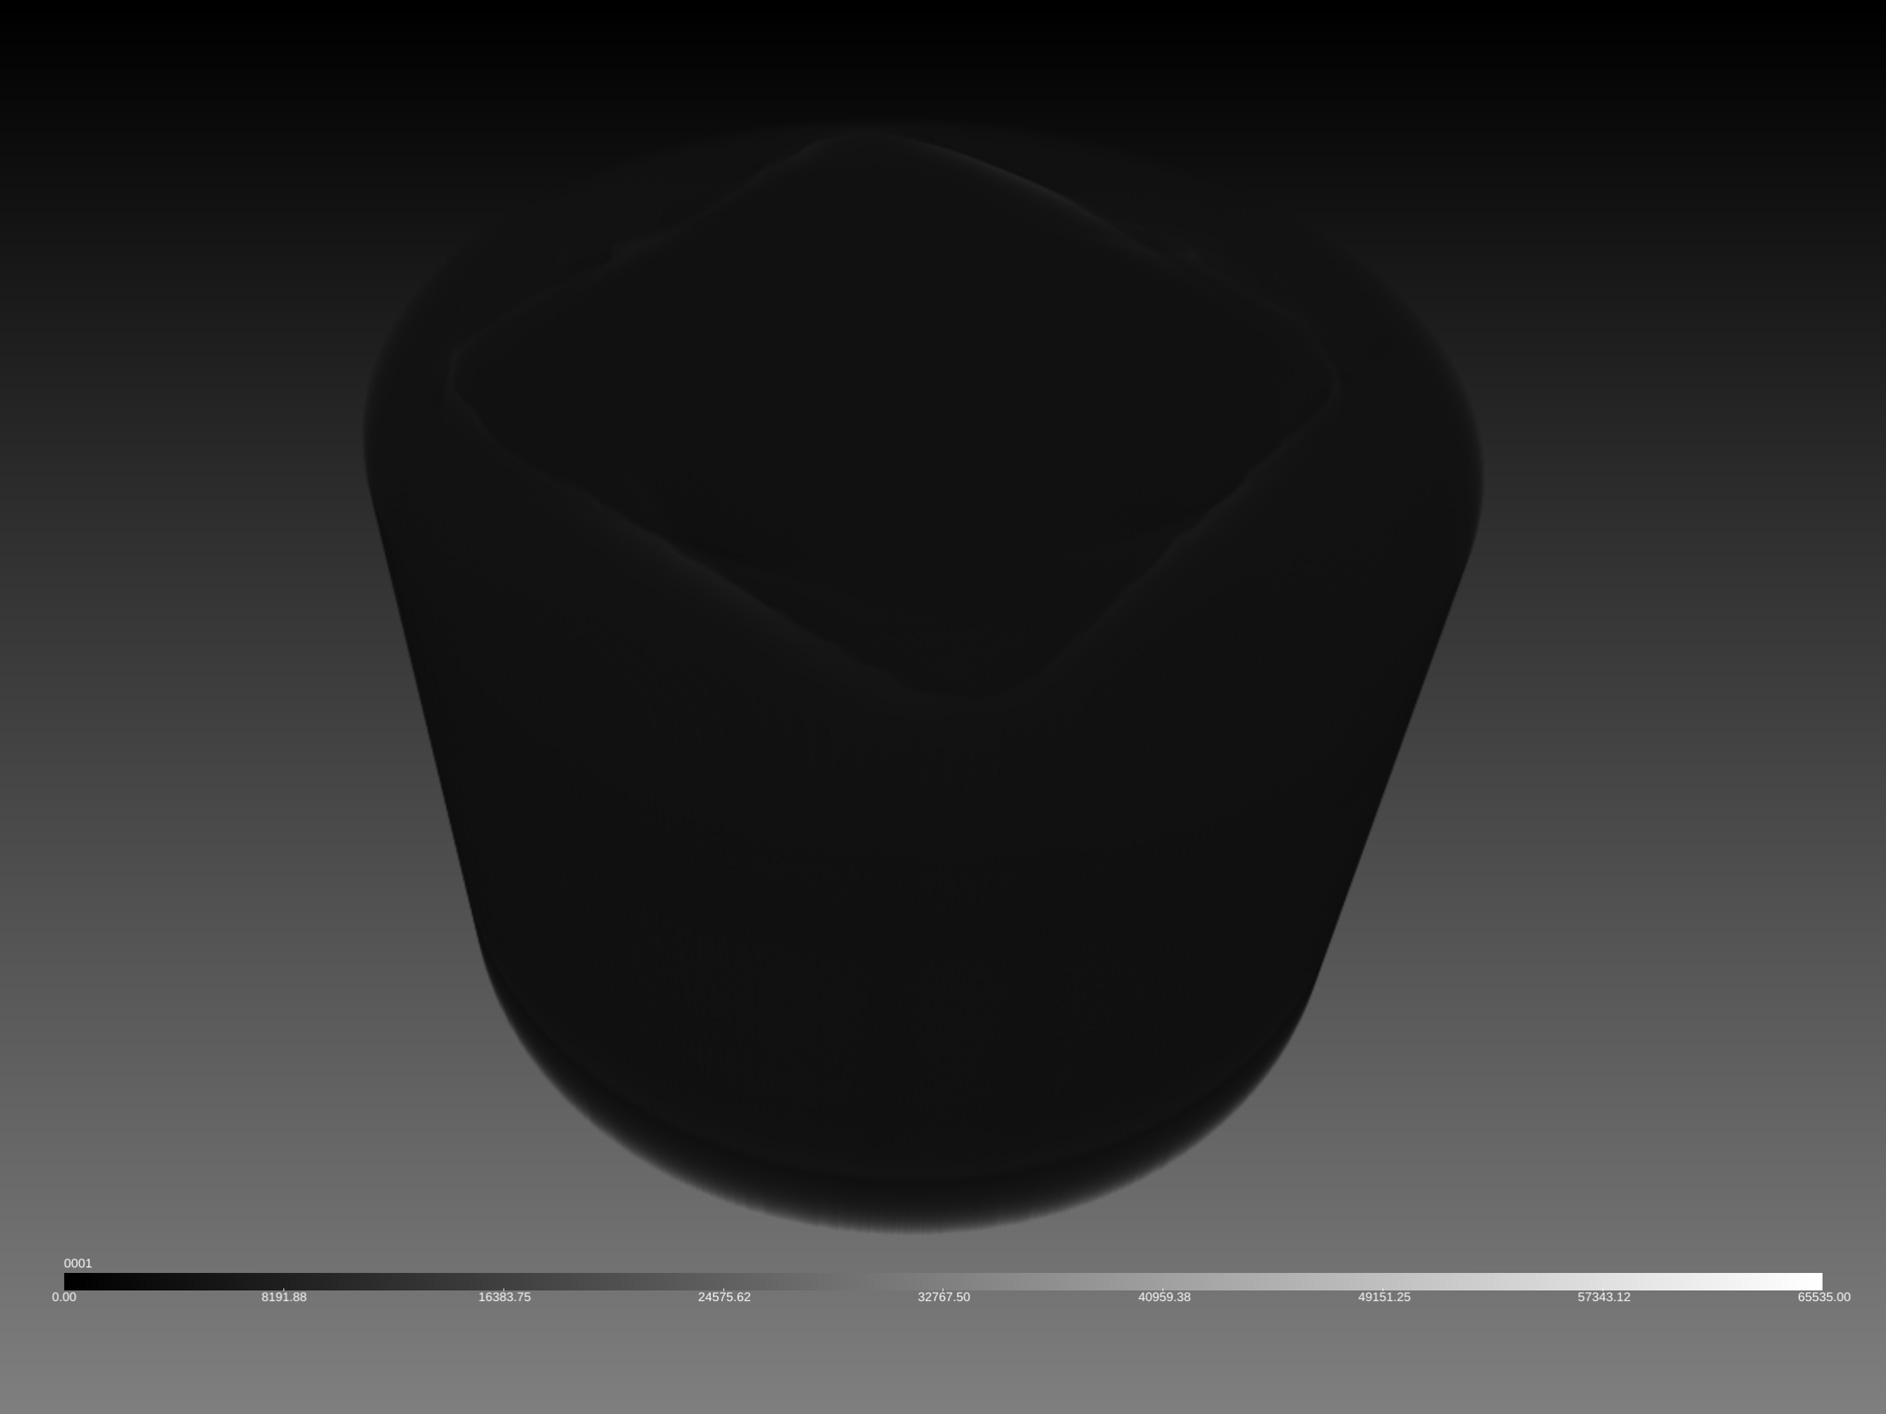
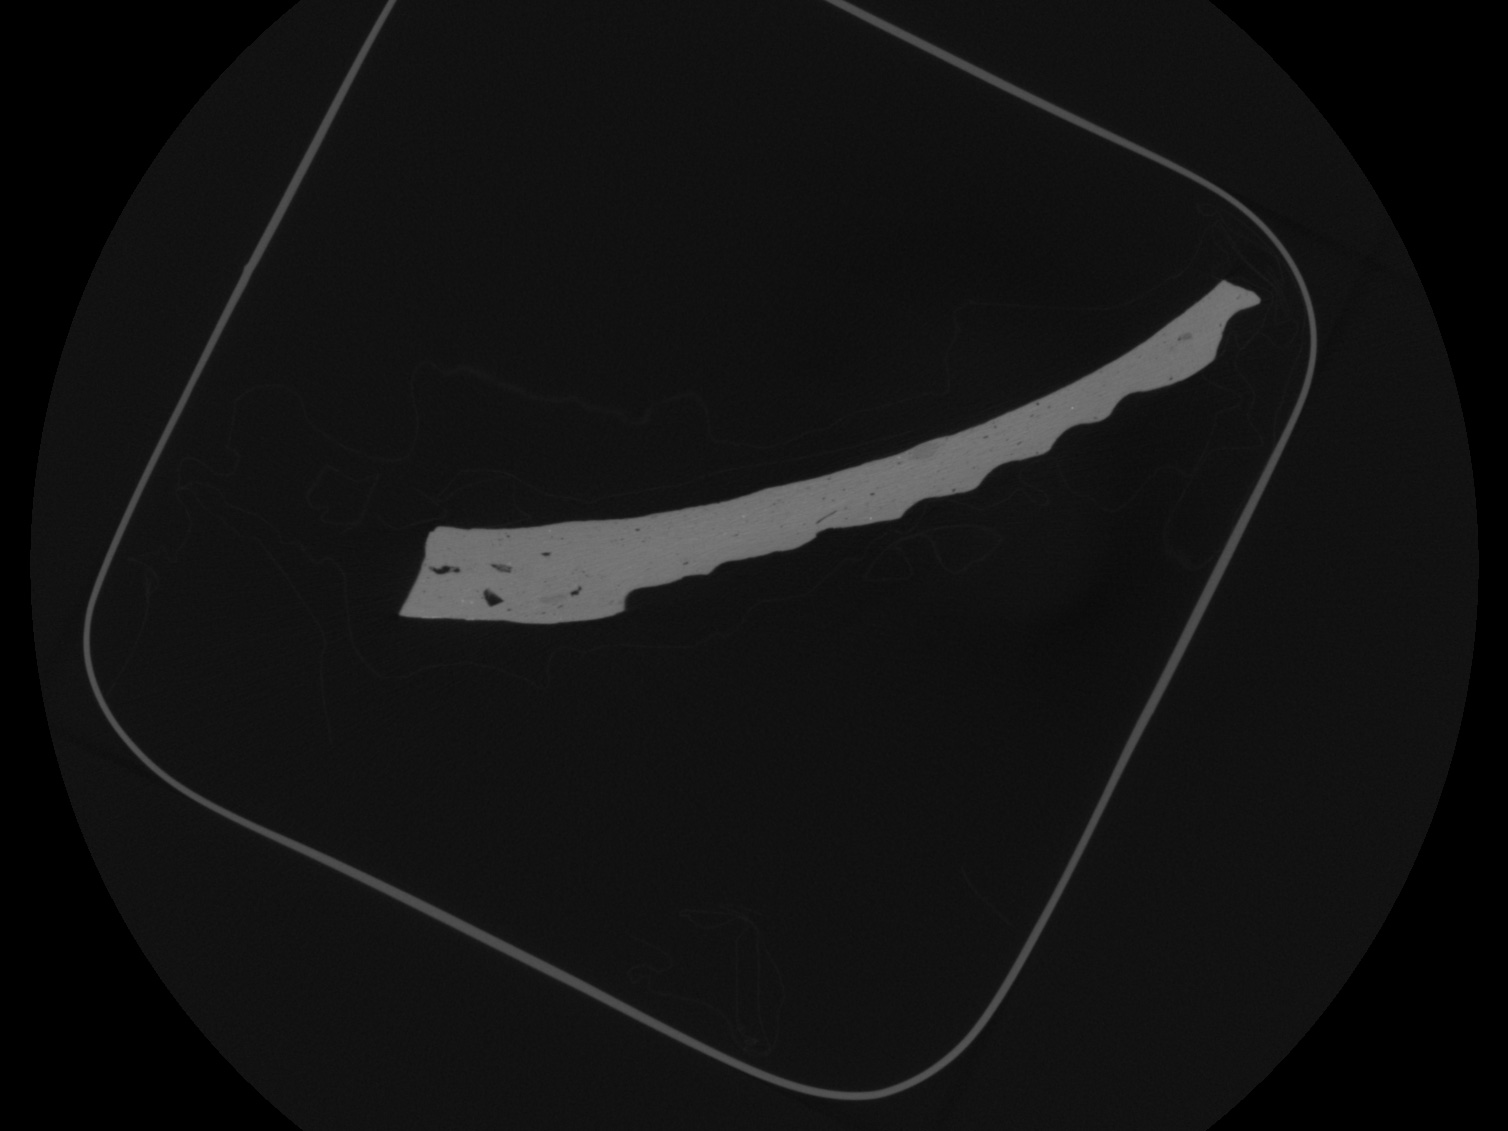
If the once analogue object is now placed on the hard drive in digital disk form, it can be loaded into a graphics program. But what happens then? The image pixels are now volumetric pixels, also called “voxel,” and are initially represented as a massive gray block. After all, everything that we define as non-shard but falls into the measuring volume is also generally measured. This includes the air, the container in which the shard is located, and the padding material that protects the shard from slipping during the entire measurement process. So the computer doesn’t know any difference between the different materials. Black and white with all the 65,534 shades in between are displayed. Properties that were previously hidden become visible only when a certain value range of the gray-scale values is hidden.
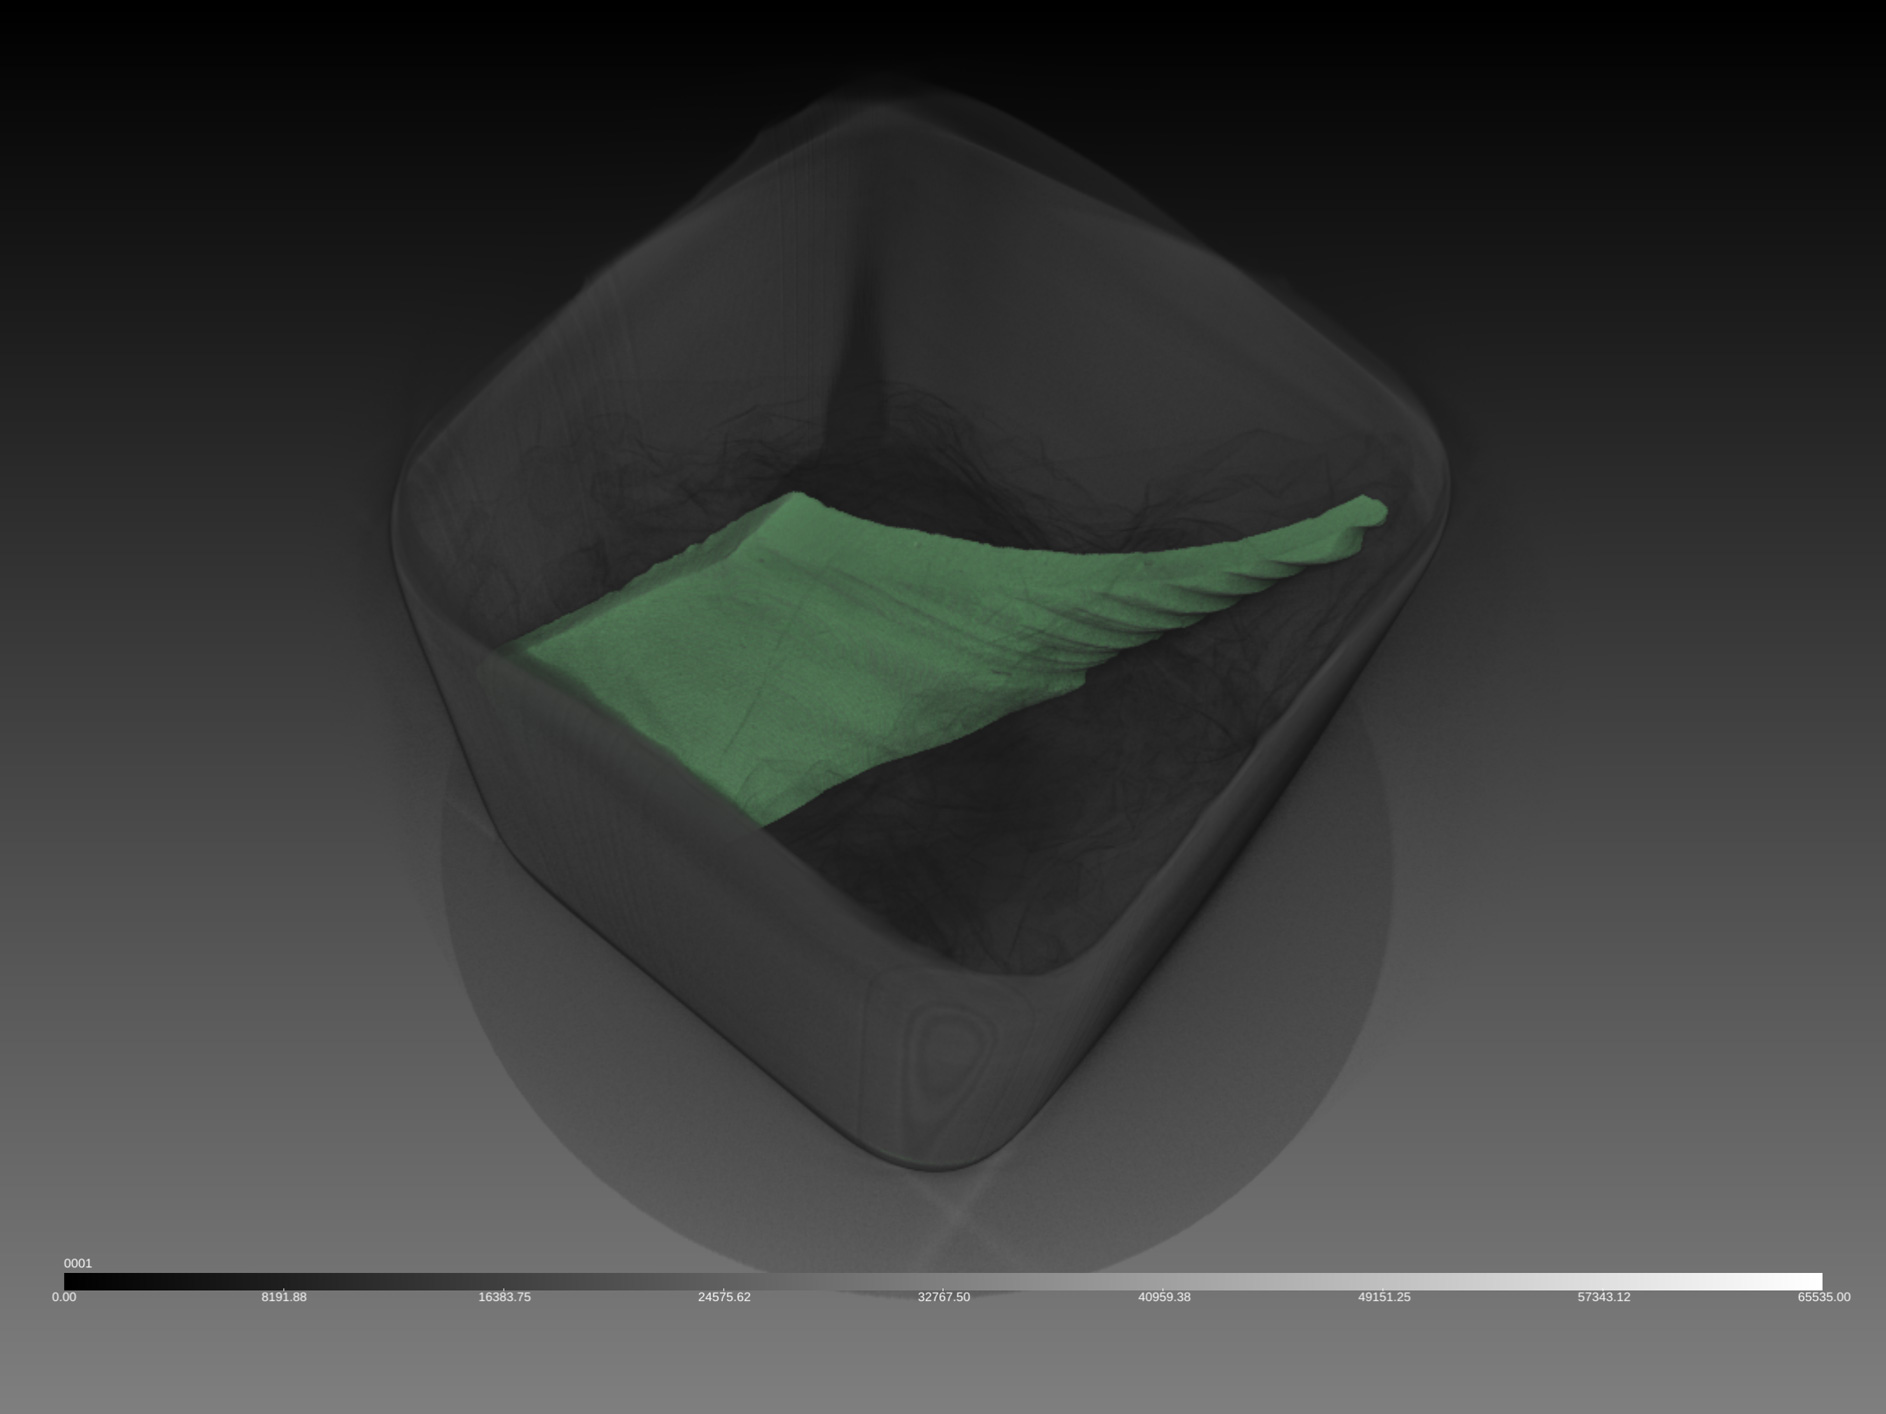
If we hide the air virtually, we see the shard in its paper nest in a plastic container, just as it was embedded in the instrument during the measurement process. For further processing, it is recommended to reduce the image volume. This is why segmentation is carried out: the gray-scale values that are of interest, i.e., those of the shard, are marked. The remaining surroundings are removed. As a result, the image volume is considerably reduced.
© Pia Götz
Turning Gray into Color
If we now want to look further into the inside of the shard, i.e., look at its inner (gray-scale) values, carefully selected value ranges can not only be hidden or displayed, but also marked in color. Contrast settings may also be helpful for visualization. We are now entering the virtual area of rendering. It is the interplay of light and shadow in an animated film scene. It is also used in computer game visualization. The result is a virtual spatial model that artistically generates the viewer’s line of sight, light effects, and depth-of-field effects on the basis of raw data.
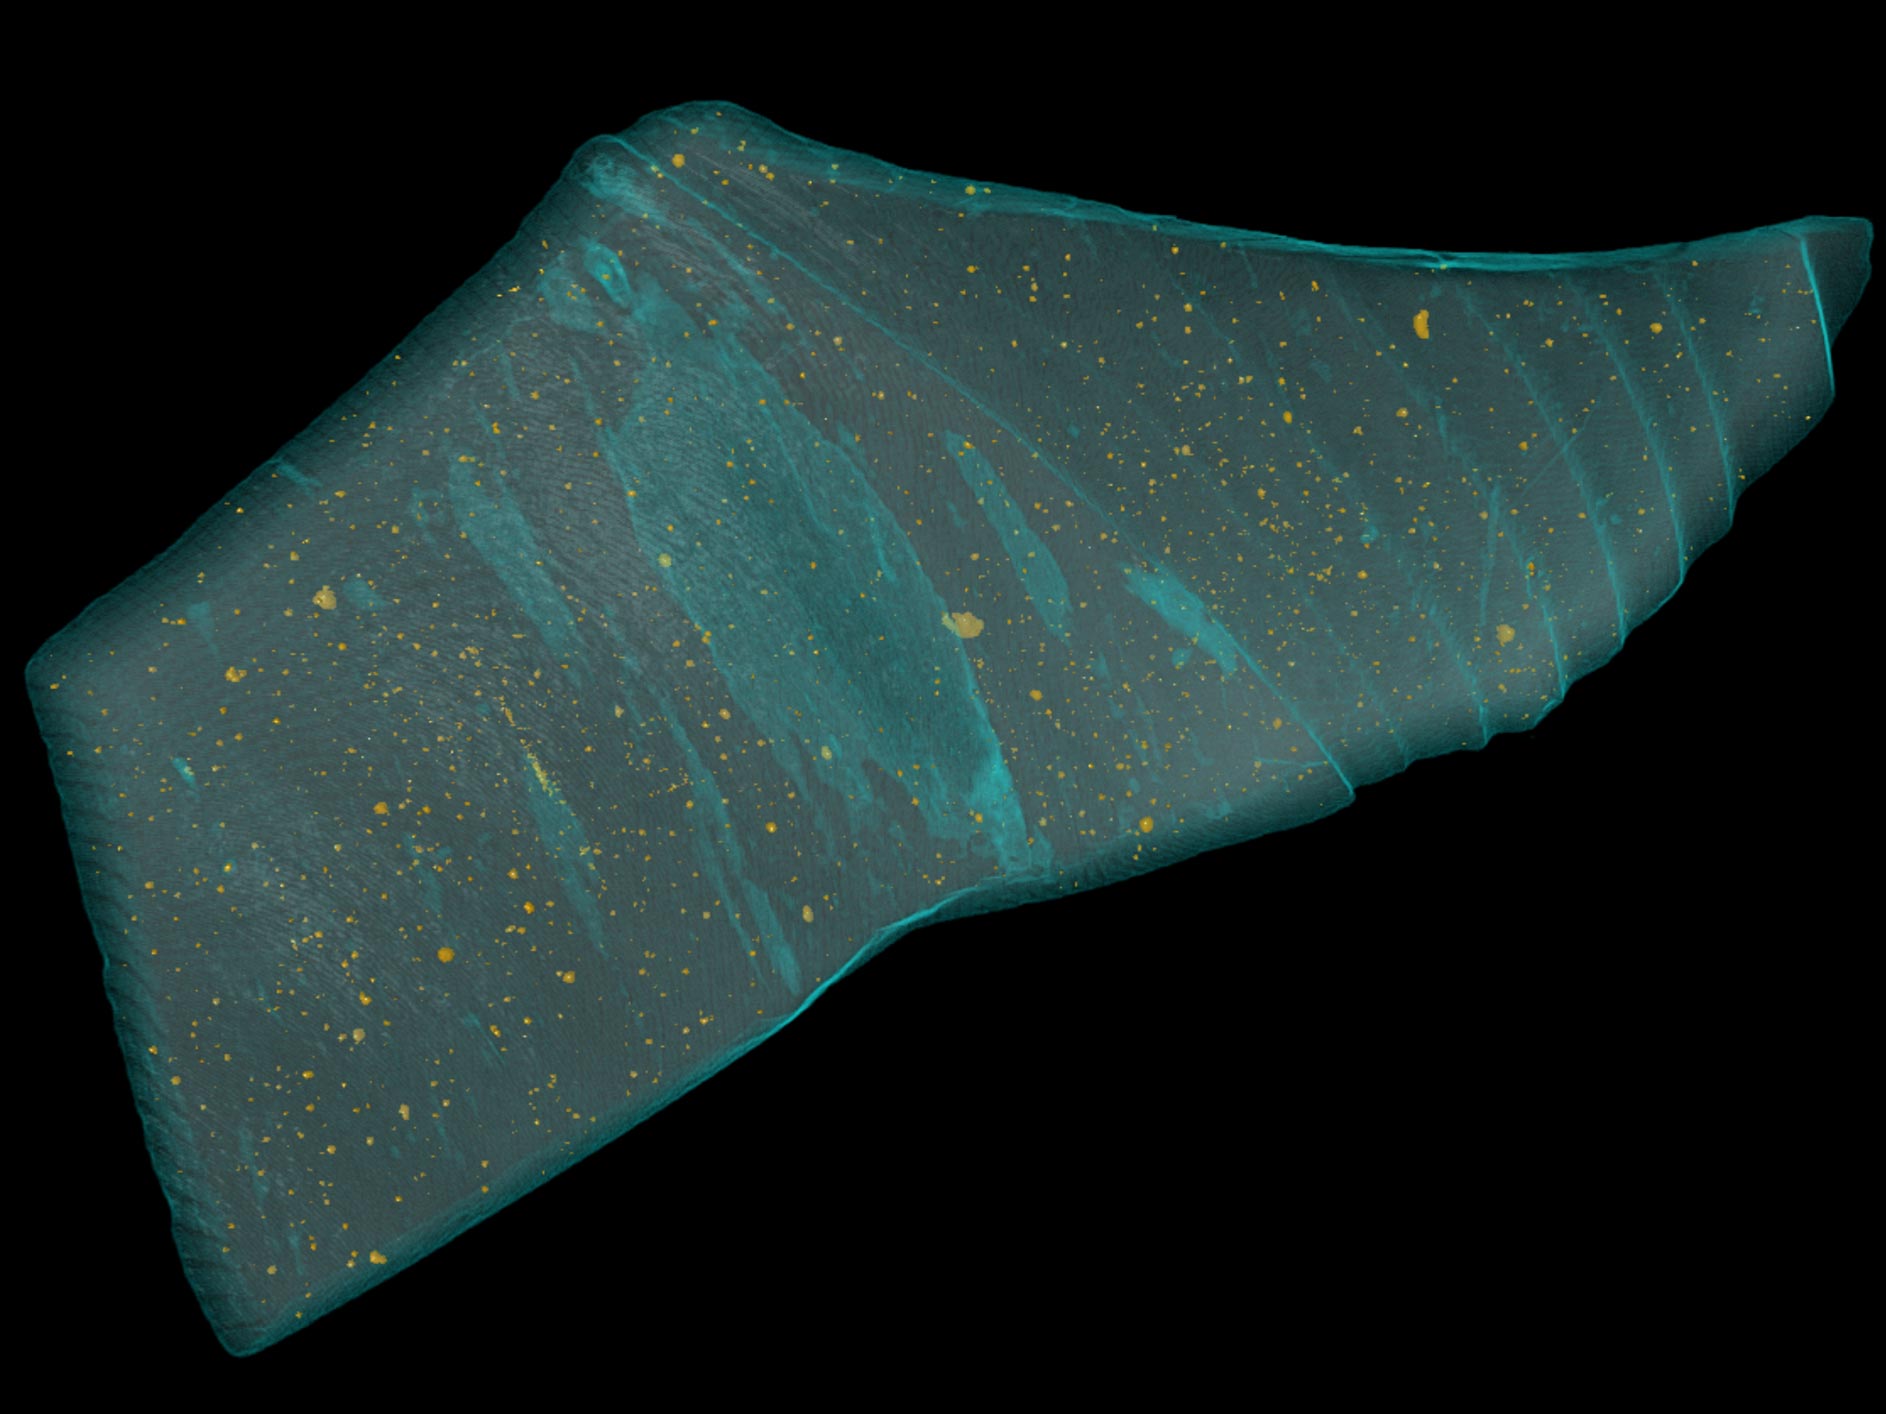
As a result, color and material properties, such as reflections on a surface, can be changed at will, completely autonomously from the analogue object. This way, air pockets in the shard are also made digitally visible when the transparency of the surrounding material is increased. The shape and distribution of these air pockets allows conclusions to be drawn about the manufacturing methods at the time. The composition of the material can also be assessed in a similar way.
© Pia Götz
Let’s just look at the yellow particles in Figure 8. These are areas with a higher gray-scale value. In this case, the material is more impermeable to X-ray radiation than the surrounding material. What could be the cause of this? What other things stand out? What materials science findings do we draw from this and what benefits does rendering have for other scientific disciplines? Soon there will be another science blog article, which will go on a journey through time to answer precisely these and other exciting questions.
The Article Comes from the MINT Science Blog
The MINT Science Blog of the University of Bremen explains challenging research topics to a wide audience. Students and junior researchers want to present complex issues in a way that is generally comprehensible. The editorial team was successful in the MINTchallenge at the start of 2021. In the Stifterverband for academia in Germany competition, it convinced the jury with its blog and took third place. More about the MINTchallenge. For more impressions and information about new articles, please visit the Science Blog’s Instagram page @scienceblog_unibremen.
Additional Information
Article in the MINT Science Blog: History of computed tomography